Longtermtrend's mission is to find the most interesting and educational charts with rich historical data - and to make these charts available online.
The price earnings ratio is calculated by dividing a company's stock price by it's earnings per share. It is likely one of the best-known fundamental ratios for stock valuation.
Market cap to GDP is a long-term valuation indicator for stocks. It has become popular in recent years, thanks to Warren Buffett.
Which was the best investment in the past 30, 50, 80, or 100 years? This chart compares the performance of the S&P 500, the Dow Jones, Gold, and Silver.
Which performed better in recent years, growth stocks or value stocks? The ratio in this chart divides the Wilshire US Large-Cap Growth Index by the Wilshire US Large-Cap Value Index. When the ratio rises, growth stocks outperform value stocks - and when it falls, value stocks outperform growth stocks. The ratio peaked in 2000, during the dot-com mania.
Which performed better in recent years, large-cap or small-cap stocks? The ratio in this chart divides the Wilshire US Large-Cap Index by the Wilshire US Small-Cap Index. When the ratio rises, large-cap stocks outperform small-cap stocks - and when it falls, small-cap stocks outperform large-cap stocks. The ratio peaked in 1999 during the dot-com mania.
What is the proportion of the Nasdaq to the overall US stock market? The ratio in this chart divides the Nasdaq Composite Index by the S&P 500. The ratio peaked in the year 2000, during the Dot-com mania.
What is the proportion of the US stock market to the global stock market?
By definition, this ratio cannot grow forever. At some point, US stocks would simply make up 100% of global stocks.
The chart shows that, since the financial crisis of 2008, US stocks have been outperforming the rest of the world.
Which performed better in recent years, emerging or developed market equities?
The ratio in this chart divides the MSCI Emerging Markets Index by the MSCI World Index.
When the ratio rises, emerging markets outperform developed markets - and when it falls, developed markets outperform emerging markets. The ratio peaked in 1994 and 2010 - and it bottomed in 2001, during the Dot-com mania.
The dow to gold ratio indicates the number of ounces of gold it takes to buy the shares in the Dow Jones Industrial Average index.
The real estate to gold ratio is a measure of relative value between gold and real estate. It indicates the number of ounces of gold required to purchase an average single family home in the United States.
The copper to gold ratio indicates the number of ounces of gold it takes to buy an ounce of copper. The ratio is an indicator of the health of the global economy and interestingly, it correlates strongly with interest rates.
The oil to gold ratio indicates the number of ounces of gold it takes to buy a barrel of oil. Similar to the copper gold ratio, the oil gold ratio is an indicator of the health of the global economy.
The gold silver ratio represents the number of silver ounces it takes to buy a single ounce of gold. Interestingly, it correlates strongly with the US Dollar index.
The M2 Money Supply is a measure for the amount of currency in circulation. This chart plots the yearly M2 Growth Rate and the Inflation Rate.
The real interest rate is calculated as the difference between the nominal interest rate and the inflation rate. This chart displays the nominal interest rate of a 1-year US Treasury bond, the US inflation rate, and the resulting one-year real interest rate.
These charts display the spreads between long-term and short-term US Government Bond Yields. A negative spread indicates an inverted yield curve. In such a scenario short-term interest rates are higher than long-term rates, which is often considered to be a predictor of an economic recession.
These charts display the yield spreads between Corporate Bonds, Treasury Bonds, and Mortgages. All bonds in this comparison have long durations, making the main differentiator the underlying credit risk. The spreads tend to widen in economic recessions and indicate an increased risk of default as well as reduced liquidity in the market.
These charts show the government-, corporate-, and household-debt to gdp ratios. Expressing a nation's debt as a ratio to its gross domestic product (GDP) allows for better comparison over time.
The stocks to commodities ratio measures the S&P 500 relative to the commodity market index PPI (Producer Price Index).
The dividend yield indicates how much a company pays out in dividends each year relative to its share price. In other words, it measures how much "bang for your buck" you are getting from dividends.
Which performed better in the past, Stocks or Bonds?
The ratio in this chart divides the S&P 500 by a Total Return Bond Index.
When the ratio rises, stocks beat bonds - and when it falls, bonds beat stocks.
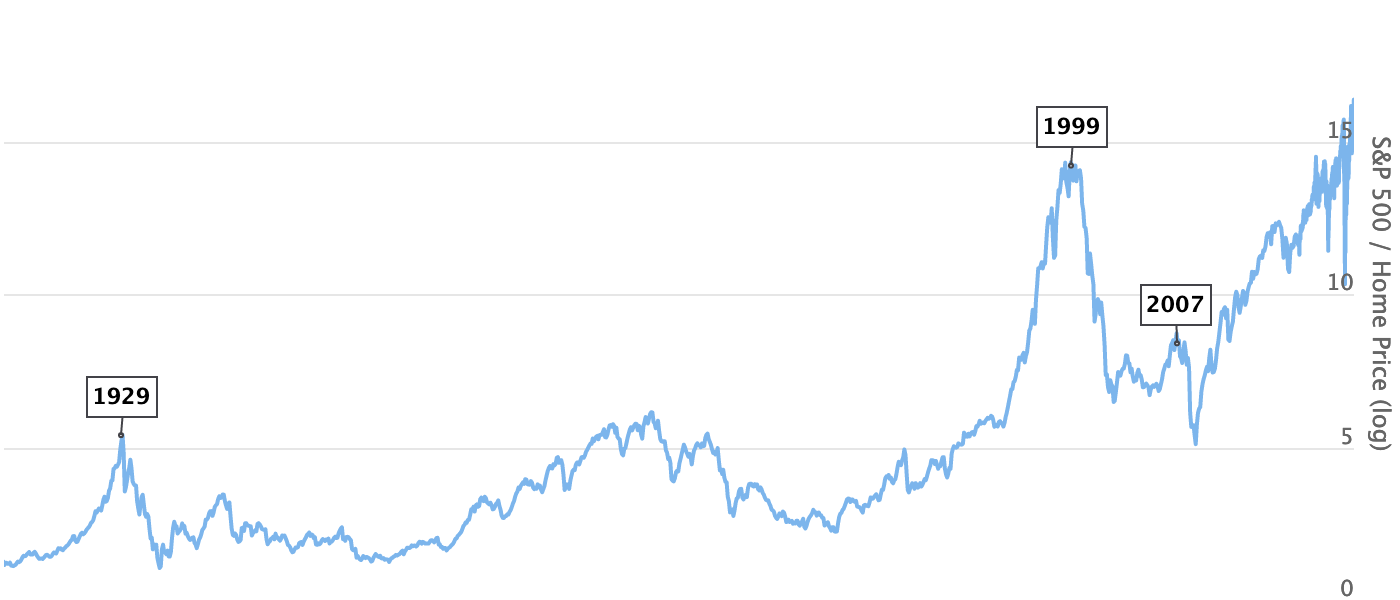
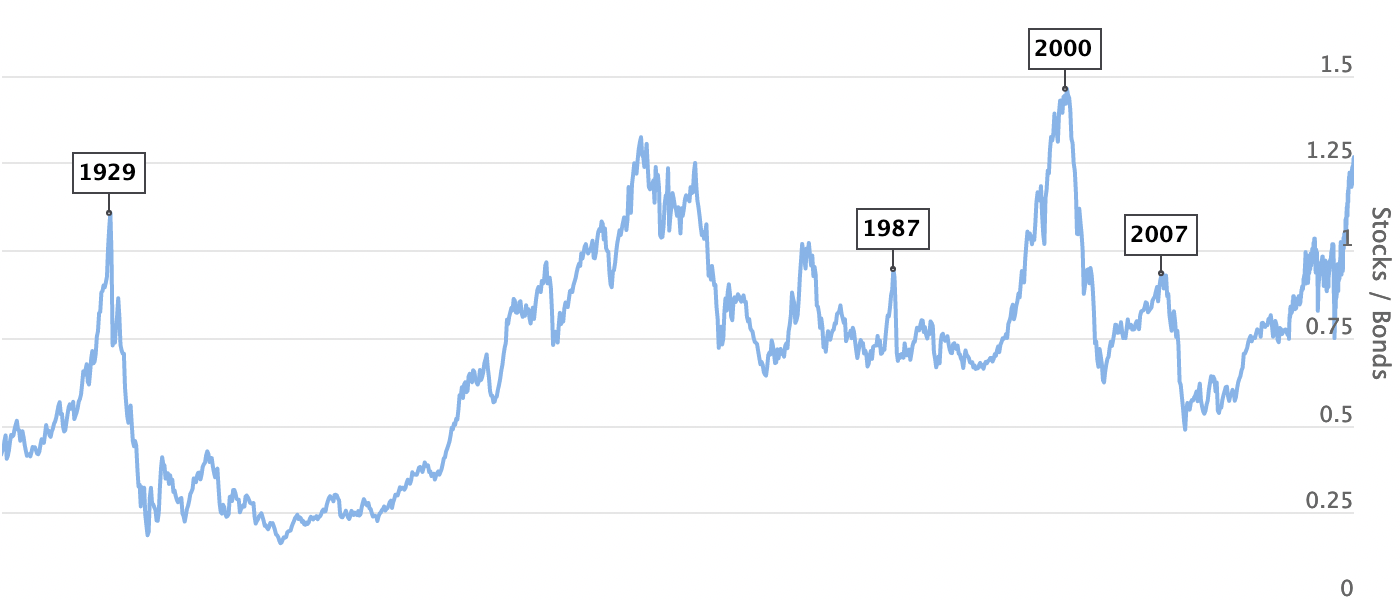
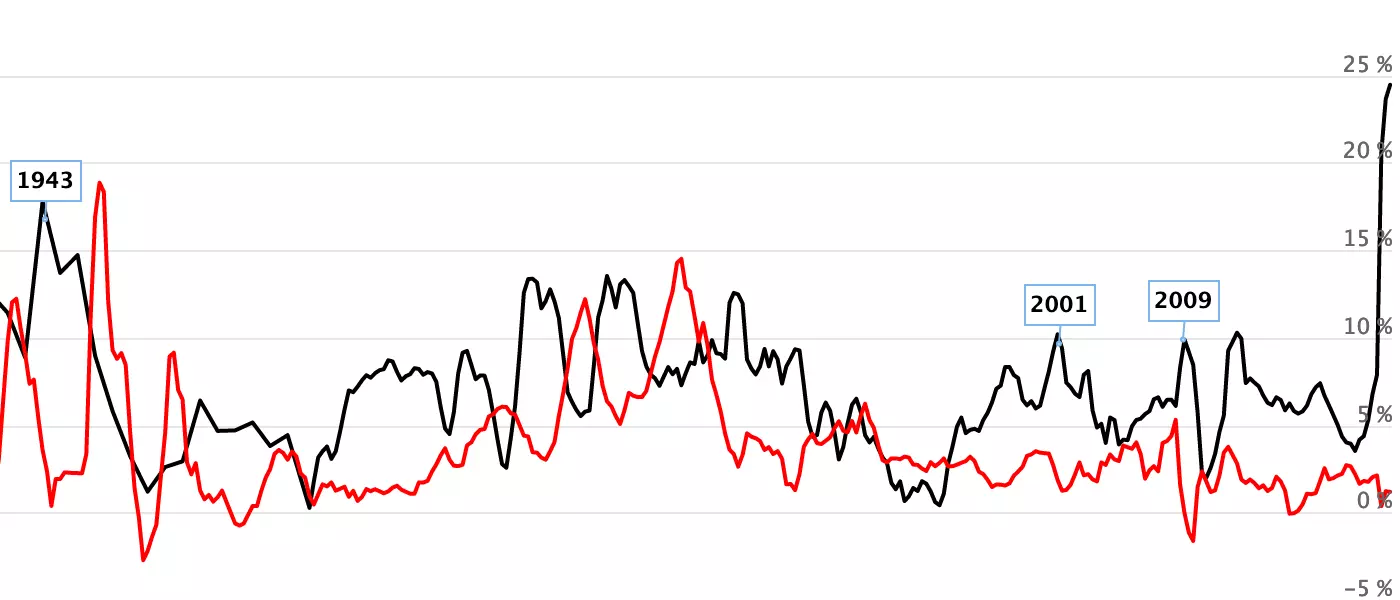
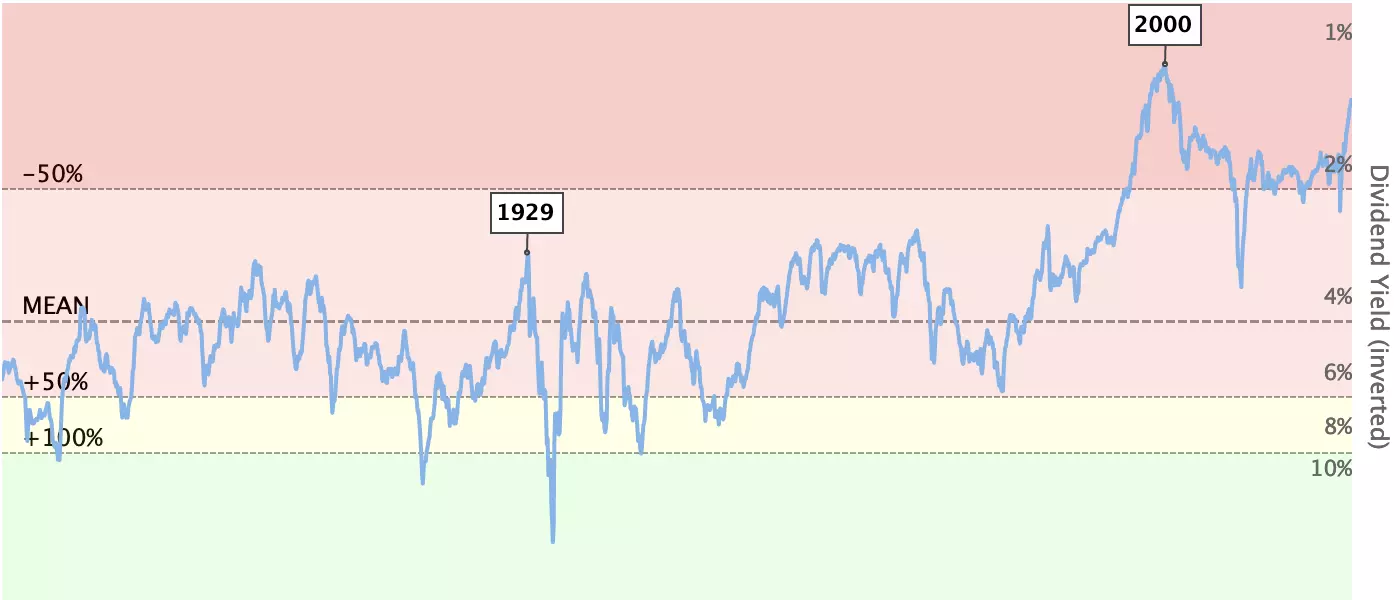
The Stocks to Real Estate ratio divides the S&P 500 index by the Case-Shiller Home Price Index. Just like Market Cap to GDP, it has an interesting historical track record and clearly shows the stock market bubbles of 1929 and 1999.
How do mining companies perform compared to the physical metals that they produce? This chart goes back all the way back to 1939.
How well performed crude oil, gold, corn, and sugar over the last couple of years? These charts compare the prices for different commodities relative to each other.
How many times their annual income do families pay for their home? Historically in the US this ratio has mostly rested between 3 and 4.
How did home prices in the US and the UK perform after taking into account the effects of inflation?
The ratios in these charts divide the nominal home price by the Consumer Price Index (CPI) and therefore display the real home price over time.
How performed American, Asian, and European stock market indices? The indices are converted into US Dollars, allowing for an accurate perfomance comparison.